Build an Interactive Startup Simulator Dashboard That Visualizes Growth, Burn Rate, and Runway in Real Time
Marketing & Branding
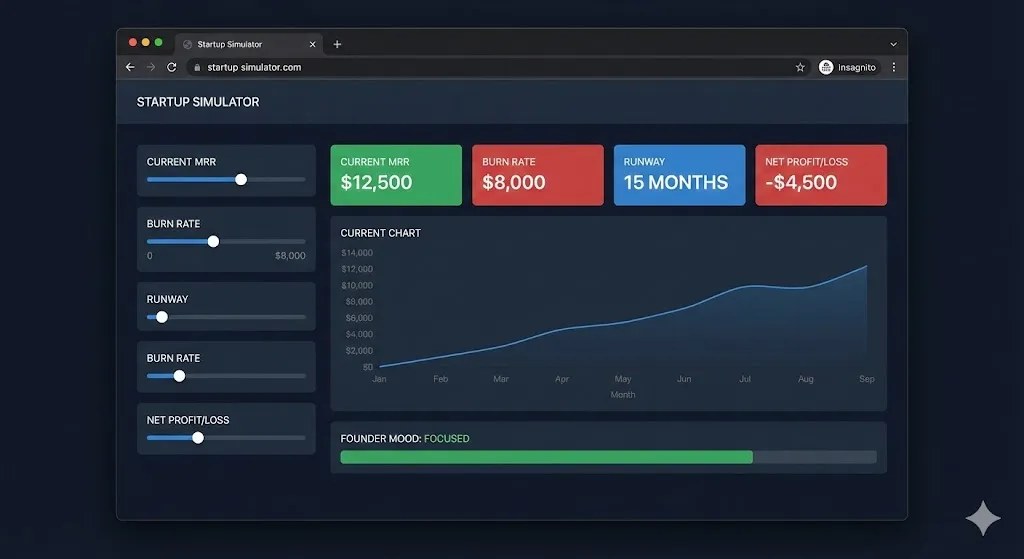
Build a fully functional micro web app that simulates the lifecycle of a startup in real time.
This is not a static dashboard.
It is an interactive financial and growth simulator that responds to user input instantly.
The app must feel like a real SaaS analytics platform.
⸻
Core Concept
The user enters:
• Monthly Revenue
• Monthly Expenses
• Team Size
• Customer Growth Rate (%)
• Churn Rate (%)
• Starting Cash Balance
The dashboard then calculates and visualizes:
• Monthly revenue growth curve
• Burn rate
• Runway (months remaining)
• Customer growth projection
• Break-even timeline
• Profitability status indicator
All calculations must update instantly when sliders or inputs change.
⸻
UI Requirements
Dark mode only.
Premium SaaS aesthetic.
Clean grid layout.
Include:
• Large KPI cards at the top:
• Current MRR
• Burn Rate
• Runway (months)
• Net Profit/Loss
• Interactive line chart for revenue projection
• Visual runway countdown bar
• Subtle animations when values change
• “Startup Health” indicator (color-based: green, yellow, red)
The app must feel calm and analytical, not gamified.
⸻
Unique Twist
Add a “Founder Mood Indicator” that changes based on runway:
• 18 months = Calm
• 12–18 months = Focused
• 6–12 months = Concerned
• <6 months = Panic Mode
Display it subtly in the UI.
⸻
Technical Requirements
• Single HTML file
• Embedded CSS and JavaScript
• No external libraries
• Custom lightweight chart using Canvas
• Local state only (no backend)
• Responsive layout
All formulas must be realistic and explained in comments.
⸻
Output Requirements
Return:
1. Complete runnable code
2. Clear comments explaining financial logic
3. Small section explaining how runway is calculated
No placeholders.
No pseudo-code.
Save Prompt